
This topic explains the types of data and its applications.
The Datatypes are extremely basic to understand the most of the concepts in routine life. It is a prerequisite for many of the applications like statistical measurements, machine learning and project management, etc.
Basically data is divided into two types.
- Numerical Data
- Categorical Data
Below picture shows the detailed view of different types of data.
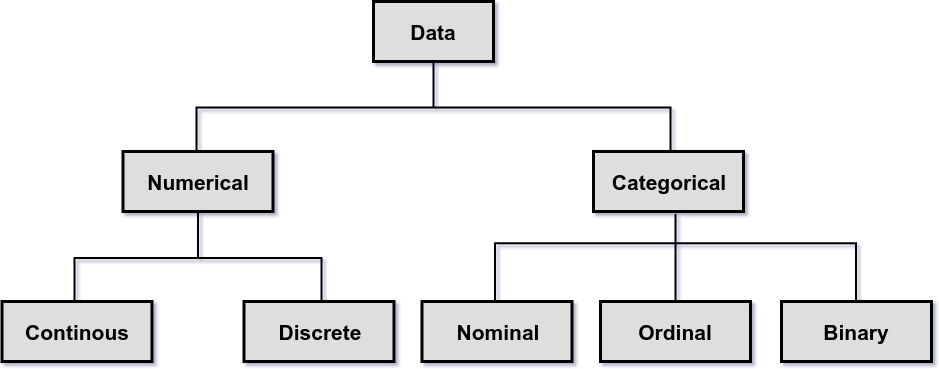
Numerical
Values or observations that can be measured. And these numbers can be placed in ascending or descending order. Scatter plots and line graphs are used to graph numerical data.
Numerical data is further divided into Continuous and Discrete.
- Continuous data represent measurements; their possible values cannot be counted and can only be described using intervals on the real number line. Height, Weight and many others which are measured using real numbers are the examples of a continous data.
- Discrete data represent items that can be counted. It can be described as a list of finite values on the whole number. No. of defects, No. of students in a class are the examples of a discrete data.
Categorical
Values or observations that can be sorted into groups or categories. Bar charts and pie graphs are used to graph categorical data.
Categorical data is further divided into Nominal, Ordinal and Binary.
- Nominal data represent named categories that do not have an implicit or natural value or rank. Student names in a class, colors in a rainbow are the examples of a nominal data.
- Ordinal data represent ordered categories that have an implicit or natural value or rank. T-shirt sizes like XXXL, XXL, XL, L, M, S is one of the examples of ordinal data.
- Binary data represent categories that have only two outcomes or values. Yes/No, 1 or 0 are the examples of binary data.
Comments