
This topic explains the method to identify the autocorrelation in the residual errors which is one of the important assumption to be evaluated for linear regression model.
Assumptions of Linear Regression:
- Linear (Linear Relationship between independent and dependent variables)
- Normal distribution (Error must be normally distributed)
- Multicollinearity (Correlation between independent variables)
- Auto-correlation (No correlation between the residual or error terms)
- Homoskedasticity (The error terms must have constant variance)
What is Autocorrelation in Linear Regression?
In Linear Regression, Autocorrelation is the correlation of a error or residuals with a delayed copy of itself.
In other words, Autocorrelation exists when residuals are not independent from each other.
Why there is an assumption to have no autocorrelation for linear regression?
If the trained model is not able to extract all the variances or information from the features or variables, then autocorrelation exists in the model residual error terms. This inturn reduces the model accuracy.
How autocorrelation in linear regression can be identified?
This can be identified by analyzing the error terms where some pattern exists.
This can also be identified and quantified using the below example code where a randomly generated data is used for linear regression.
Steps to check the autocorrelation:
1) Compute the error term using the prediction and actual data
2) Compute the sign change of the error (0 or 1)
3) Compare the sum of sign change and cutoff value
4) Autocorrelation exist if sum of sign change is less than or equal to cutoff value
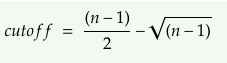
where n = number of observations
# Import libraries for basic python operation

import numpy as np
import matplotlib.pyplot as plt
%matplotlib inline
def random():
    np.random.seed(1) # generate same numbers
    X = np.arange(50)
    delta = np.random.uniform(0,15,size=(50,))
    y = .4 * X + 3 + delta
    return X,y
def standardize(data):
    data -= np.mean(data)
    data /= np.std(data)
    return data
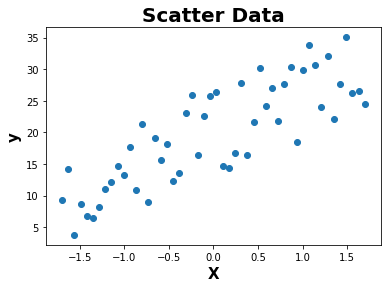
def plot(X,y):
    plt.scatter(X,y)
    plt.xlabel('X',fontweight="bold",fontsize = 15)
    plt.ylabel('y',fontweight="bold",fontsize = 15)
    plt.title('Scatter Data',fontweight="bold",fontsize = 20)
    plt.show()
def gradient_descent(X,y):
    m_updated = 0
    b_updated = 0
    mse = []
    iterations = 500
    learning_rate = 0.01
    n = len(X)

    for i in range(iterations):
        y_pred = (X * m_updated) + b_updated

        error = y_pred - y

        mse.append(np.mean(np.square(error)))

        m_grad = 2/n * np.matmul(np.transpose(X),error)
        b_grad = 2 * np.mean(error)

        m_updated -= learning_rate * m_grad
        b_updated -= learning_rate * b_grad


    return [m_updated,b_updated,mse]
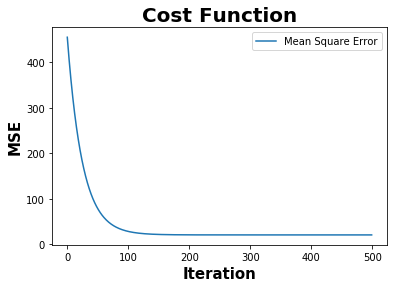
def plot_cost_function(mse):
    plt.plot(mse,label="Mean Square Error")
    plt.xlabel('Iteration', fontweight="bold", fontsize = 15)
    plt.ylabel('MSE', fontweight="bold", fontsize = 15)
    plt.title('Cost Function',fontweight="bold",fontsize = 20)
    plt.legend()
    plt.show()
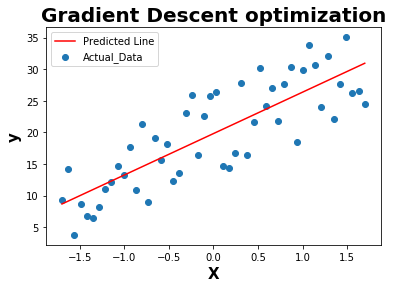
def plot_line(X,y,y_pred):
    plt.scatter(X,y,label="Actual_Data")
    plt.plot(X,y_pred,c='r',label = "Predicted Line")
    plt.xlabel('X', fontweight="bold", fontsize = 15)
    plt.ylabel('y', fontweight="bold", fontsize = 15)
    plt.title('Gradient Descent optimization',fontweight="bold",fontsize = 20)
    plt.legend()
    plt.show()
def sign_change(error):

    n = len(error)
    sign_change = []

    for i in range(n):

        if i > 0:

            if (error[i-1]*error[i]) < 0:
                sign_change.append(1)
            else:
                sign_change.append(0)

        else:
            sign_change.append(0)

    return sign_change
def autocorrelation(error,sign_change):

    cutoff = ((len(error)-1)/2)-np.sqrt(len(error)-1)

    if np.sum(sign_change) <= cutoff:
        print("Autocorrelation exist in the model residuals")
    else:
        print("Autocorrelation does not exist in the model residuals")
if __name__ == "__main__":

    X,y = random()

    X = np.array(X).astype(np.float32)
    y = np.array(y).astype(np.float32)
    X = X.reshape(-1,1)
    y = y.reshape(-1,1)

    # Normalize the features
    X = standardize(X)

    plot(X,y)

    # Gradient Descent Optimization

    m,b,mse = gradient_descent(X,y)

    # Cost Function

    plot_cost_function(mse)

    # Prediction using m and b

    y_pred = m * X + b

    plot_line(X,y,y_pred)

    # Error or Residuals

    error = y - y_pred

    # Sign change in the residuals to find out the pattern

    sign_change = sign_change(error)

    # Percentage of Sign Change in the model residuals

    percent_sign_change = (np.sum(sign_change)/(len(sign_change)-1))*100

    print("Percentange of sign_change in the Residual error terms : ",percent_sign_change)

    # Check the autocorrelation in the model residuals

    autocorrelation(error,sign_change)
Percentange of sign_change in the Residual error terms :  51.02040816326531

Autocorrelation does not exist in the model residuals
As per the above example, autocorrelation doesnot exist within residual error as the number of sign changes is greater than the cutoff value.
References :
- https://www.statisticssolutions.com/autocorrelation/
- https://en.wikipedia.org/wiki/Autocorrelation
- https://newonlinecourses.science.psu.edu/stat501/node/357/
Comments