
This topic explains the elbow method to determine an optimal number of clusters for any given data using K-Means clustering machine learning algorithm.
As per Wikepedia, “The correct choice of k is often ambiguous, with interpretations depending on the shape and scale of the distribution of points in a data set and the desired clustering resolution of the user. In addition, increasing k without penalty will always reduce the amount of error in the resulting clustering, to the extreme case of zero error if each data point is considered its own cluster (i.e., when k equals the number of data points, n). Intuitively then, the optimal choice of k will strike a balance between maximum compression of the data using a single cluster, and maximum accuracy by assigning each data point to its own cluster. If an appropriate value of k is not apparent from prior knowledge of the properties of the data set, it must be chosen somehow. There are several categories of methods for making this decision.”
The below example uses the elbow method to find out the correct choice of K for randomly generated data.
import numpy as np
import pandas as pd
from sklearn import metrics,preprocessing
from sklearn.cluster import KMeans
import matplotlib.pyplot as plt
%matplotlib inline
Function below to generate some random numbers
def random_numbers():
    X1 = []
    X2 = []
    np.random.seed(1) # generate same numbers
    for i in range(0,25):
        X1.append(i)
        X2.append(np.random.randint(100))

    for i in range(25,50):
        X1.append(i)
        X2.append(np.random.randint(200,300))

    for i in range(50,75):
        X1.append(i)
        X2.append(np.random.randint(400,500))

    for i in range(75,100):
        X1.append(i)
        X2.append(np.random.randint(600,700))

    return [X1,X2]
Data Normalization
def normalize(data):
    maxs = np.max(data)
    mins = np.min(data)
    diff = maxs-mins
    data = (data-mins)/diff
    return data
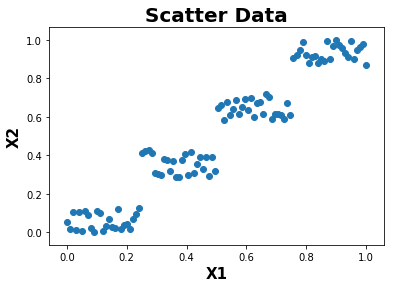
def plot(X1,X2):
    plt.scatter(X1,X2)
    plt.xlabel('X1',fontweight="bold",fontsize = 15)
    plt.ylabel('X2',fontweight="bold",fontsize = 15)
    plt.title("Scatter Data",fontweight="bold",fontsize = 20)
    plt.show()
Elbow Method
def elbow_method(data):
    cluster = []
    for i in range(1,10):
        kmeans = KMeans(n_clusters = i, init = "k-means++", max_iter = 1000, n_init = 10, random_state = 0)
        kmeans.fit(data)
        cluster.append(kmeans.inertia_)
    return cluster
def plot_cluster(cluster):
    plt.plot(range(1,10),cluster)
    plt.xlabel('No of Clusters',fontweight="bold",fontsize = 15)
    plt.ylabel('Sum of Squared Errors',fontweight="bold",fontsize = 15)
    plt.title("Elbow Method using scikit-learn",fontweight="bold",fontsize = 20)
    plt.show()
def sklearn_model(data):
    kmeans = KMeans(n_clusters = 4, init = "k-means++", max_iter = 1000, n_init = 10, random_state = 0)
    kmeans.fit(data)
    labels = kmeans.predict(data)
    centroids = kmeans.cluster_centers_
    plt.scatter(data[:,0],data[:,1],c=kmeans.labels_,cmap="rainbow")
    plt.scatter(centroids[:,0],centroids[:,1],marker="*",c="black")
    plt.xlabel('X1',fontweight="bold",fontsize = 15)
    plt.ylabel('X2',fontweight="bold",fontsize = 15)
    plt.title("K-means Cluster using scikit-learn",fontweight="bold",fontsize = 20)
    plt.show()
if __name__ == "__main__":
    X1,X2 = random_numbers()
    X1 = np.array(X1).astype(float)
    X2 = np.array(X2).astype(float)
    X1 = normalize(X1)
    X2 = normalize(X2)
    plot(X1,X2)
    data = np.array(list(zip(X1,X2)))
    cluster = elbow_method(data)
    plot_cluster(cluster)
    sklearn_model(data)
Randomly generated scatter data
Choice of K using elbow method
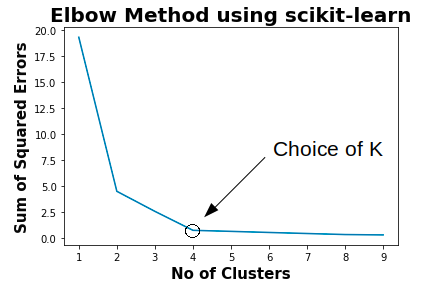
Using the above plot, the choice of K for the given data can be 2 or 4. The better choice for the given data is 4 as per error convergence.
Clustering using K-means Clustering Algorithm
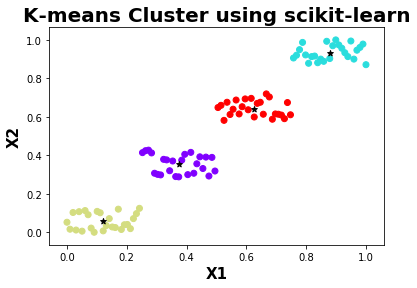
The above plot shows the given data are clustered as 4 seperate groups with different colors and a centroid. The data clustered using 4 seperate groups gives more meaning than grouping into 2 groups visually.
References :
- https://scikit-learn.org/
- https://stackoverflow.com/
- https://en.wikipedia.org/wiki/K-means_clustering
- https://en.wikipedia.org/wiki/Cluster_analysis
- https://en.wikipedia.org/wiki/Determining_the_number_of_clusters_in_a_data_set
Comments