
This topic explains the method to understand the categorical data using the pie chart and bar chart.
Data ingestion
Python library is a collection of functions and methods that allows you to perform many actions without writing your code. To make use of the functions in a module, you’ll need to import the module with an import statement.
import numpy as np
import scipy.stats
import pandas as pd
Matplotlib is a magic function in IPython.Matplotlib inline sets the backend of matplotlib to the ‘inline’ backend. With this backend, the output of plotting commands is displayed inline within frontends like the Jupyter notebook, directly below the code cell that produced it.
import matplotlib
import matplotlib.pyplot as plt
%matplotlib inline
data = pd.read_csv('smoking.csv')
Download the smoking.zip
data.info()
result:
<class 'pandas.core.frame.DataFrame'>
RangeIndex: 8 entries, 0 to 7
Data columns (total 4 columns):
Geography      8 non-null object
Death          8 non-null object
Year           8 non-null int64
No_of_death    8 non-null float64
dtypes: float64(1), int64(1), object(2)
memory usage: 336.0+ bytes
data.head(8)
result:
| Geography | Death | Year | No_of_death | |
|---|---|---|---|---|
| 0 | Central Asia | Direct | 2016 | 10850.849556 |
| 1 | East Asia | Direct | 2016 | 136695.858414 |
| 2 | South Asia | Direct | 2016 | 163215.353336 |
| 3 | Southeast Asia | Direct | 2016 | 88841.171786 |
| 4 | Central Asia | Indirect | 2016 | 1186.888912 |
| 5 | East Asia | Indirect | 2016 | 14004.767712 |
| 6 | South Asia | Indirect | 2016 | 24297.978568 |
| 7 | Southeast Asia | Indirect | 2016 | 9064.151679 |
groupby_type = data.groupby(["Death","Geography"]).No_of_death.value_counts(normalize=True)
groupby_type
result:
Death     Geography       No_of_death
Direct    Central Asia    10850.849556     1.0
          East Asia       136695.858414    1.0
          South Asia      163215.353336    1.0
          Southeast Asia  88841.171786     1.0
Indirect  Central Asia    1186.888912      1.0
          East Asia       14004.767712     1.0
          South Asia      24297.978568     1.0
          Southeast Asia  9064.151679      1.0
Name: No_of_death, dtype: float64
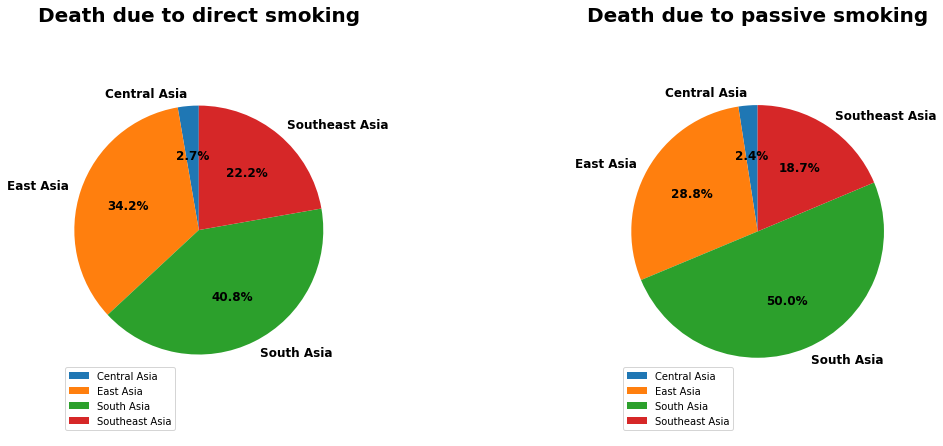
Pie chart
A pie chart is a circular statistical graphic, which is divided into slices to illustrate numerical proportion.
plt.figure(figsize=(15,7.5))
plt.subplot(1,2,1);
data[data.Death == 'Direct'].No_of_death.plot(kind='pie',startangle=90,autopct='%1.1f%%',colors=['C0','C1','C2','C3'],labels = ['Central Asia', 'East Asia', 'South Asia', 'Southeast Asia'],textprops={'fontweight':'bold','fontsize': 12});
plt.legend(loc=3,fontsize=10)
plt.ylabel('')
plt.title('Death due to direct smoking',fontweight="bold",fontsize = 20)
plt.axis('equal')

plt.subplot(1,2,2);
data[data.Death == 'Indirect'].No_of_death.plot(kind='pie',startangle=90,autopct='%1.1f%%',colors=['C0','C1','C2','C3'],labels = ['Central Asia', 'East Asia', 'South Asia', 'Southeast Asia'],textprops={'fontweight':'bold','fontsize': 12});
plt.legend(loc=3,fontsize=10)
plt.ylabel('')
plt.title('Death due to passive smoking',fontweight="bold",fontsize = 20)
plt.axis('equal')

plt.subplots_adjust(wspace=1)
plt.show()
hypothesis = data[(data.Geography == "South Asia")]
hypothesis.set_index("Death",drop=True,inplace=True)
hypothesis
result:
| Geography | Year | No_of_death | |
|---|---|---|---|
| Death | |||
| Direct | South Asia | 2016 | 163215.353336 |
| Indirect | South Asia | 2016 | 24297.978568 |
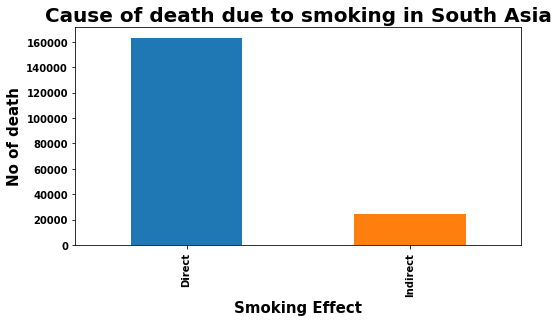
Bar Chart
A bar chart or bar graph is a chart or graph that presents categorical data with rectangular bars with heights or lengths proportional to the values that they represent. The bars can be plotted vertically or horizontally. A vertical bar chart is sometimes called a line graph.
# Bar Chart

plt.figure(figsize=(8,4))
hypothesis.No_of_death.plot(kind='bar')
plt.title('Cause of death due to smoking in South Asia',fontweight='bold',fontsize = 20)
plt.xlabel('Smoking Effect',fontweight='bold',fontsize = 15)
plt.ylabel('No of death',fontweight='bold',fontsize = 15)
plt.xticks(fontweight="bold",fontsize = 10)
plt.yticks(fontweight="bold",fontsize = 10)
plt.show()
References :
- https://ourworldindata.org/smoking
- https://stackoverflow.com/
Comments