
This topic explains the statistics method to remove the outliers in the given data.
import numpy as np # for multi-dimensional arrays and matrices operations
import scipy.stats # for scientific computing and technical computing
import pandas as pd # data manipulation and analysis
import seaborn as sns # Python's Statistical Data Visualization Library
import matplotlib # for plotting
import matplotlib.pyplot as plt
%matplotlib inline
arr = [10, 386, 479, 627, 20, 523, 482, 483, 542, 699, 535, 617, 577, 471, 615, 583, 441, 562, 563, 527, 453, 530, 433, 541, 585, 704, 443, 569, 430, 637, 331, 511, 552, 496, 484, 566, 554, 472, 335, 440, 579, 341, 545, 615, 548, 604, 439, 556, 442, 461, 624, 611, 444, 578, 405, 487, 490, 496, 398, 512, 422, 455, 449, 432, 607, 679, 434, 597, 639, 565, 415, 486, 668, 414, 665, 763, 557, 304, 404, 454, 689, 610, 483, 441, 657, 590, 492, 476, 437, 483, 529, 363, 711, 543]
data = np.array(arr,dtype=float)
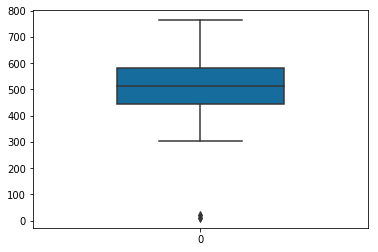
Identify outliers visually
# Plot box plot to find out the outliers using a single feature or variable
sns.boxplot(data=data,
                 width=0.5,
                 palette="colorblind")
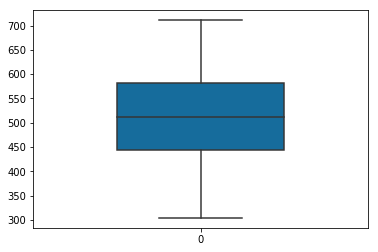
Remove outliers
Remove the outlier points by eliminating any points that were above (Mean + 2SD) and any points below (Mean - 2SD) before plotting the frequencies.
mean = np.mean(data, axis=0)
sd = np.std(data, axis=0)

final_list = [x for x in data if (x > mean - 2 * sd)]
final_list = [x for x in final_list if (x < mean + 2 * sd)]
# Plot box plot to find out the outliers using a single feature or variable
sns.boxplot(data=final_list,
                 width=0.5,
                 palette="colorblind")
Comments